Operational Research Examples |
 |
The purpose of this page is two-fold - firstly, to demonstrate the usefulness of OR in general, and, secondly to demonstrate the capabilities of the consultancy team at Andalus Solutions.
Our first example is the development of a tool in Excel which collates real-time and historic stocks and shares information from Yahoo! Finance for user-selected companies. Stock Analyser uses VBA macros to provide a user-friendly tool.
A second example comes from a real-world problem where a group of workmates try to decide which pub to go to. This may not immediately sound like much of a problem but in reality the decision process saw a large number of emails being sent to-and-fro every Friday, and a subsequent reduction in productivity. This problem was solved through the development of PikkaPub, an automatic pub picking program, which uses an OR methodology to make a weighted random pub selection.
A third, and somewhat more serious, example comes from research undertaken by Andrew Eaves on the management of spare parts. The Royal Air Force (RAF) maintains a very large inventory of consumable spare parts and it is demonstrated that cost-savings will arise if more accurate demand forecasting is utilised.
The final example is a chi-square goodness-of-fit testing model for determining whether sample data fits a range of theoretical probability distributions, including Poisson, normal, gamma, and several others. There is no need to assume that a series of numbers are normally distributed for example, as this can be mathematically determined.
Stock Analyser |
 |
Download Stock Analyser.xls (992KB).
| |||
Real-time stocks and shares information |
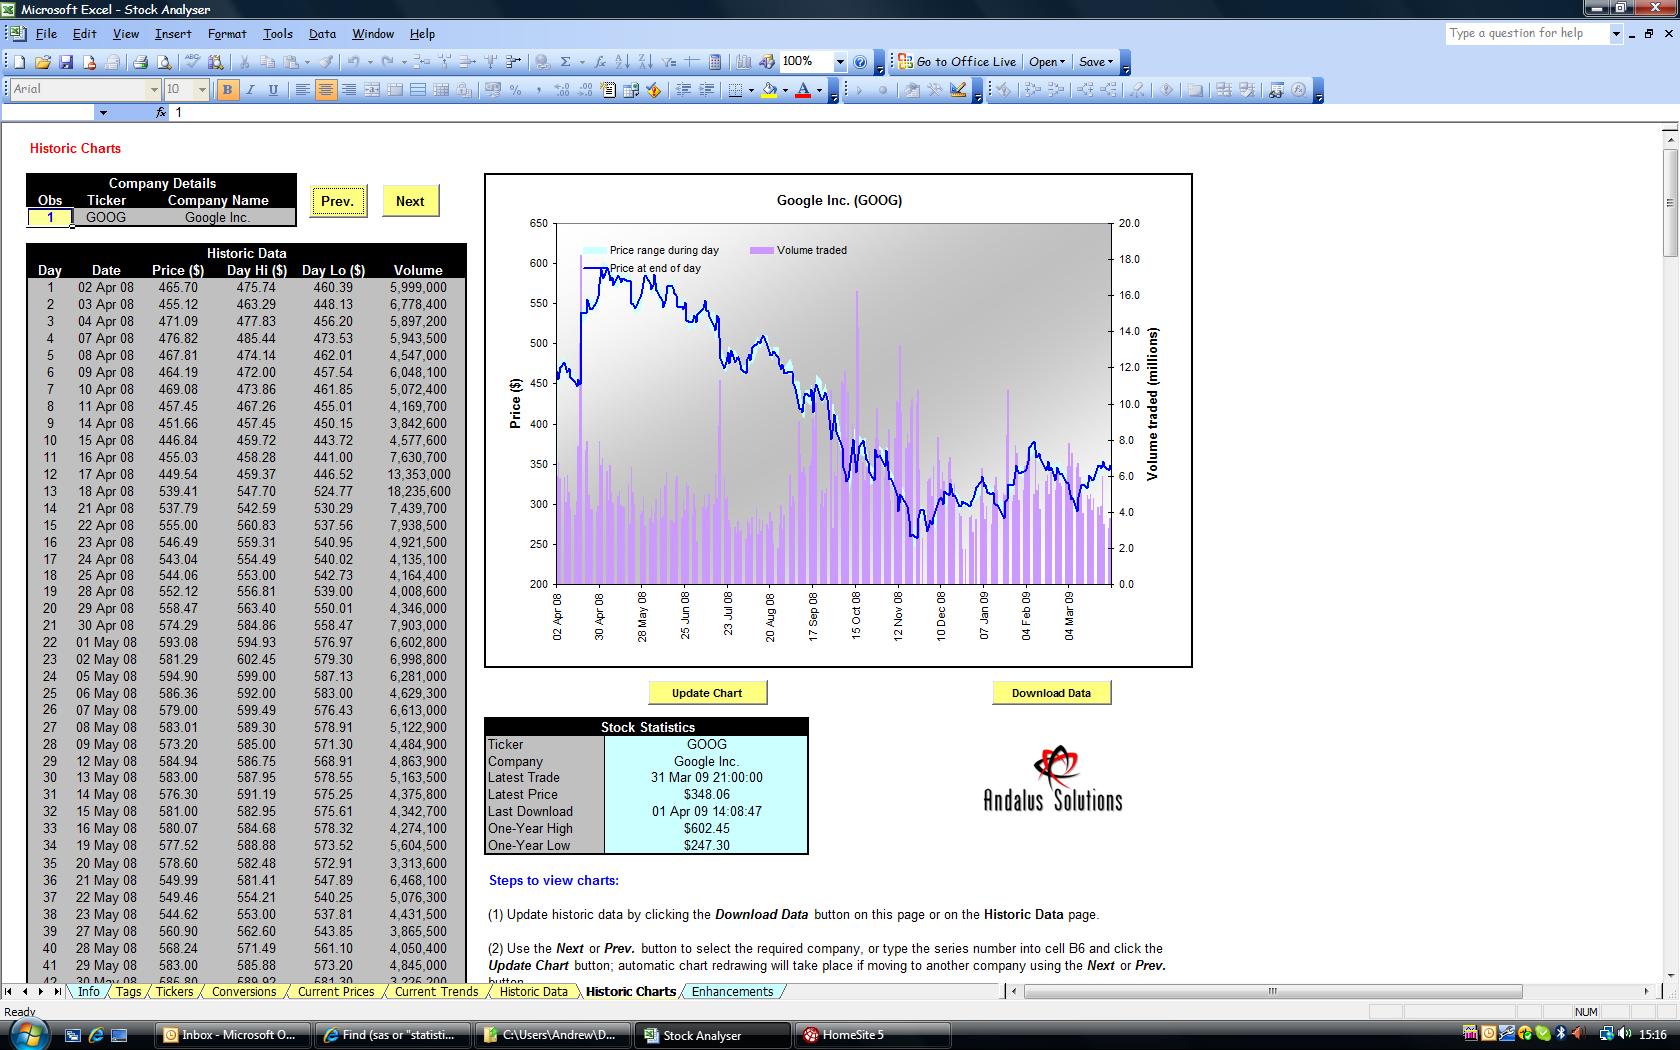
Stock Analyser retrieves stocks and shares information from the internet for user-selected companies.
| Figure 1: Stock Analyser Screen. |
 |
Further information on the Stock Analyser tool is available from andrew(at)andalus-solutions.com.
Back to topPikkaPub |
|
Download Pikkapub.xls (118KB).
| |||
The Automatic Pub Picking Program |
The Problem:
In a large conurbation such as London, workers are faced with a multitude of drinking establishments from which to regularly choose one suitable for after work intoxication. As it happens, different pubs offer different levels of enjoyment for different people, so the old adage holds true - you cannot please all the people all of the time. Hence, from time-to-time an unfortunate individual who makes a poor pub decision is open to abuse along the lines of "Why are we here for the sixth time in a row?" or "This place is horrible! Who in their right mind would choose to come here?".
What is required is a pub selection procedure which recognises the desires of your pub-going population on an on-going basis. The skills attained by an OR practitioner are up to this challenge!
The Challenge:
Several criteria, some of them conflicting, have been identified, which must be addressed for a solution to be acceptable:
- The selected pub should normally be local in order to minimise wasted drinking time.
- However, distant and rarely-visited pubs offer the opportunity for discovery and excitement.
- A particular pub should not be visited too regularly or boredom tends to set in.
- Pub-goers should have some input in order to minimise abuse aimed at the decision-maker.
- Selecting a pub and advising your drinking partners of the selection should be a simple task.
The Solution:
Using VBA macros in Microsoft Excel, PikkaPub randomly selects a pub from a pre-defined list at the touch of a button. Pubs are initially assigned weightings based on the voting of the pub-going population. Hence, more popular pubs are selected more often than less popular pubs, and if the pub list is long then very rarely would a pub be selected twice in a row. Pubs which are more difficult to get to can be given a low weighting so that they are only selected infrequently, but when they do come up it gives you the chance to sample somewhere new. The pub selection is made in a fruit-machine fashion for entertainment purposes.
The PikkaPub program randomly combines comments around the pub selection to form a coherent statement that is copied and ready for pasting to an electronic notice-board for everyone to read. Furthermore, an individual pub-goer is also randomly selected, unbeknown to them, for the message to go out under their name. This allows you to convincingly pass the blame for a poor pub selection, or a dubious message, onto someone else.
An example output is shown below, where the text consists of three randomly chosen comments surrounding the selected pub. For added amusement the year of establishment in this case is also randomly generated.
Pub: | the Marlborough Arms |
  |
Person: | Richard | |
Text: | We're collecting for the NHS via the tax on every pint, short and other measure, and your contributions will be collected by the landlord at the Marlborough Arms, a popular drinking establishment since 1877. This is your last chance for a pint before Armageddon! |
Although PikkaPub is suggesting our efforts will be in vain, the team have been working on other developments to add to the Pikka-program suite.
The Future:
The PikkaPub methodology is equally applicable to any repetitive decision-making process you would rather not have to think too hard about, such as choosing a partner for a meaningful short-term relationship or choosing small animals with short lives to share your home with ... look out for the ever-useful PikkaPartner and PikkaPet programs coming soon!
Back to topForecasting for the Ordering and Stock-Holding of Consumable Spare Parts
Ph.D. Thesis written by Andrew Eaves, Lancaster University, July 2002.
Download PhD Thesis (Eaves).pdf (1,488KB) |
"For want of a nail the shoe was lost; |
Benjamin Franklin (1706-1790) |
Abstract: A modern military organisation like the Royal Air Force (RAF) is dependent on readily available spare parts for in-service aircraft and ground systems in order to maximise operational capability. Parts consumed in use, or otherwise not economically repaired, are classified as consumable, comprising nearly 700 thousand stock-keeping units. A large proportion of parts with erratic or slow-moving demand present particular problems as far as forecasting and inventory control are concerned. This research uses extensive demand and replenishment lead-time data to assess the practical value of models put forward in the academic literature for addressing these problems.
An analytical method of classifying parts by demand pattern is extended and applied to the RAF consumable inventory. This classification allows an evaluation of subsequent results across a range of identified demand patterns, including smooth, slow-moving, irregular and erratic. For a model to be considered useful, it should measurably improve forecasting and inventory control, and given the large inventory should not be overly complex as to require excessive processing. In addition, a model should not be too specialised in case it has a detrimental effect when demand does not adhere to a specific pattern.
Recent forecasting developments are compared against more commonly used, albeit less sophisticated, forecasting methods with the performance assessed by using traditional measures of accuracy, such as MAD, RMSE and MAPE. The results are not considered ideal in this instance as the measures themselves are open to questions of validity and different conclusions arise depending on which measure is utilised. As an alternative the implied stock-holdings, resulting from the use of each method, are compared. One recently developed method, a modification to Croston's method referred to as the approximation method, is observed to provide significant reductions in the value of the stock-holdings required to attain a specified service level for all demand patterns.
| Figure 2: Example Demand Patterns. |
 |
Further information on this research is available from andrew(at)andalus-solutions.com.
Back to topGoodFit |
|
Download Statistical Testing.exe (702KB).
| |||
A Chi-Square Goodness-of-Fit Testing Model |
A goodness-of-fit test tests the null hypothesis that a random sample was drawn from a population with a specified distribution, such as a normal distribution, for example. A common form of this test is the chi-square goodness-of-fit test, which measures the degree of fit between observed (Oi ) and expected (Ei ) frequencies.
The chi-square statistic is calculated as:
 | |
where k is the number of categories. |
A calculated chi-square statistic less than the appropriate tabulated value indicates a good fit and the null hypothesis is not rejected.
It is suggested that the chi-square test works best when all expected frequencies are at least 5 and if a category is too small it should be combined with one or more neighbouring categories. Usually the groupings are somewhat arbitrary and questions arise as to what constitutes suitable boundaries when combining categories. It frequently occurs that one grouping will accept the null hypothesis, whereas another grouping will not. The standard test is difficult to apply automatically to large quantities of data while ensuring consistently fair groupings.
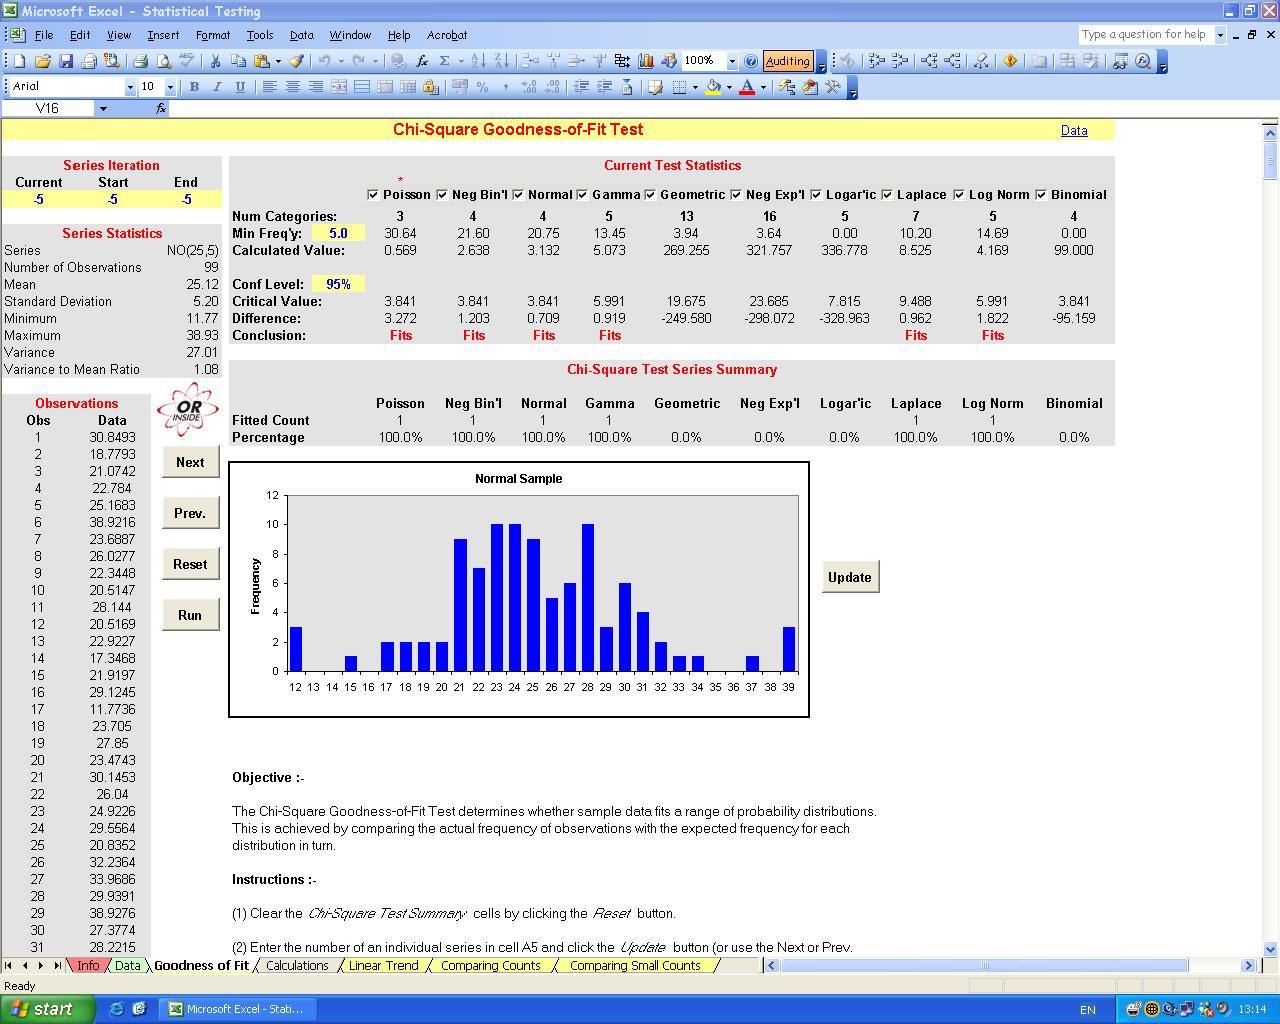
GoodFit uses a modified chi-square goodness-of-fit testing method where boundaries are specified by forming categories with similar theoretical frequencies throughout, rather than combining groups just at the margins. This allows the method to be applied automatically. GoodFit will iterate the number of categories from the minimum determined by the degrees of freedom up to a maximum of either a set number or when the theoretical frequency in a group drops below a specified limit. If at any point the null hypothesis is not rejected, the data is assumed to fit the distribution being tested and another distribution can be considered.
The model can test for a fit against the Poisson, negative binomial, normal, gamma, geometric, negative exponential, logaritmic, Laplace, log normal and binomial distributions at any user defined significance level.
| Figure 3: GoodFit Statistics Screen. |
 |
Further information on the GoodFit Model is available from andrew(at)andalus-solutions.com.
Back to topTwo secrets for success:
(1) Never tell them everything you know.